The relationships that both Nassau and Suffolk Counties have in regards to the stewardship of waters that both surround and provide drinking water are historically complex. Both counties are dependent on the ocean and sound to provide critical tourism and recreation services, as well as provide a boost to real estate markets. Long Island’s waterfront real estate is among the most prolific in the country. This valuable real estate generates property taxes that help to fill the coffers of local governments across the Island. Underground, Long Islanders pump freshwater that supports industries, residential and commercial needs from the nation’s first federally designated sole-source aquifer. The complex system is already being threatened by poor land use planning and policy decisions. To further exacerbate the groundwater system’s troubles, the threat of sea level rise due to Global Warming is seen as a threat to Long Island’s drinking and surface water quality. According to research gathered by the US Environmental Protection Agency (EPA):
A rise in sea level would:
(1) inundate wetlands and lowlands
(2) erode shorelines
(3) exacerbate coastal flooding
(4) increase the salinity of estuaries and aquifers and otherwise impair water quality
(5) alter tidal ranges in rivers and bays
(6) change the locations where rivers deposit sediment
(7) increase the heights of waves
(8) decrease the amount of light reaching the bottom of sea beds. Previous assessments have mostly focused on the first four factors.[1]
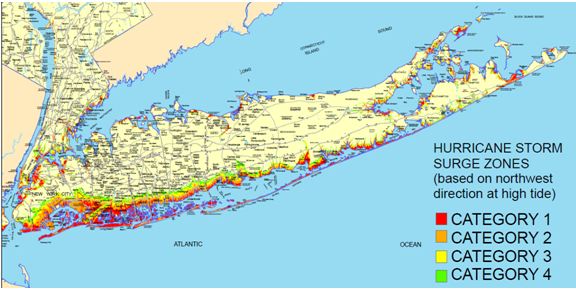
The below Suffolk County Storm surge maps provide good insight as to what Long Island would look like if sea levels rose due to Global Warming. Storm surge flooding can also serve to simulate Global Warming sea level rise:
Tide gauge measurements show sea level on Long Island has risen nearly 11 inches over the past century. Much of that’s due to global warming, said James G. Titus, an expert in rising sea levels at the federal Environmental Protection Agency. Many scientists expect the trend to accelerate as greenhouse gas emissions increase, and they’re urging communities to plan ahead.
The Goddard Institute for Space Studies and Columbia University’s Earth Institute predict sea levels around Long Island could rise as much as 4 1/2 feet over the next 70 years. That could mean greater threats to the homes of nearly a half-million residents who live in the low-lying South Shore floodplain, according to estimates by Nassau and Suffolk officials.[2]
The EPA has done extensive research on the impacts elevated seas will have on groundwater resources:
The impact of sea level rise on groundwater salinity could make some areas uninhabitable even before they were actually inundated, particularly those that rely on unconfined aquifers just above sea level.
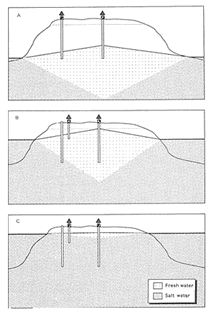
The below graphic from the EPA contains three illustrations, each depicting sea level rise on different water table elevations:
The first illustration, figure 7a, depicts an area where freshwater is plentiful and sea level rise has had little effect. The second and third illustrations, figures 7b and 7c, depict the outcome of sea level rise where freshwater is less plentiful. In figure 7b, an area with more elevation the sea level rise is less of a problem. In figure 7c, a low lying area, the amount of freshwater under ground has declined:
Areas of Long Island’s low-laying south shore and narrow north fork are especially in danger of salt water intrusion, which is already a problem due to over pumping. Long Island is best represented by both scenarios B, which would represent the water table on the north shore and the glacial moraine, and C, which would represent the flood plain along the south shore.
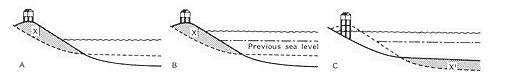
The practical importance of distinguishing erosion from inundation varies (Park et al. 1989). Along the very low deltaic coasts, erosion would merely reclaim land a few decades before it was inundated anyway. On barrier islands and sandy cliffed coasts, however, where a one meter rise would only inundate 5-20 meters of beach, erosion would account for the majority of land lost.
(A) Initial condition. (B) Immediate inundation when sea level rises. (C) Subsequent erosion due to sea level rise. A rise in sea level immediately results in shoreline retreat due to inundation, shown in first two examples. However, a 1 m rise in sea level implies that the offshore bottom must also rise 1 m. The sand required to raise the bottom (X’) can be supplied by beach nourishment. Otherwise waves will erode the necessary sand (X) from the upper part of the beach as shown in (C). Source: Titus, 1986.[4]
Fears of sea-level rise impacting aquifers are a concern to areas as close as New Jersey, which:
Sea level rise can enable saltwater to penetrate coastal aquifers. Aquifer salinization may be compounded during droughts or in regions with significant overdraft (when water is extracted from the aquifer faster than it can be naturally replaced), because the aquifer may lack sufficient water pressure to prevent the ocean from backing up into groundwater. The Potomac-Raritan-Magothy aquifer system in particular is an important water source for residential and industrial centers in the coastal region of southern New Jersey (Luzier, 1980). During a drought in 1961-66, the salt front (defined as 100 milligrams/liter chloride) moved 50 km inland and salt water recharged the Potomac-Raritan-Magothy aquifer, increasing chloride concentrations in wells 10 to 70 mg/liter above background levels (5-10 mg/liter) (Camp Dresser and Mckee, 1982; Hull and Titus, 1986). These chloride levels remained elevated for more than 10 years.
Aquifers provide the sole or principle source of water for at least 14 of New Jersey’s 21 counties and the Coastal Plain Aquifer System covers all of central and southern New Jersey (U.S. EPA, 1988). In addition, much of New Jersey is dependent on coastal watersheds for water. A 0.61 m or 1.22 m rise in sea level over the next century would allow the salt front to advance further upstream in watersheds and permit saline waters to penetrate coastal aquifers. The increasing salinity may contaminate drinking water supplies and limit the water available for agricultural and industrial uses. In response, New Jersey’s would be required to regulate and drastically reduce water usage or find alternative supplies of water at substantial cost (Hull and Titus, 1986).[5]
…to as far as Island County Washington, where they reported on the potential challenges in their Draft Shoreline Inventory and Characterization:
Saltwater intrusion into sole-source aquifers, and potential exacerbation from sea level rise[6]
In New York, the DEC has issued its report to the State Legislature on sea level rise in December of 2010. In the report, the DEC identified the challenges posed by sea level rise to the sole source aquifer, with their concerns being in line with those of Washington State, New Jersey and the US EPA:
Saltwater Intrusion
As seawater rises, it encroaches upon estuarine, brackish and freshwater environments, increasing their salinity and permanently altering ecosystems. Saltwater intrusion also threatens aquifers and other freshwater sources of public drinking water.
Drinking Water Supplies
Salt water intrusion threatens potable water supplies, especially on Long Island, where salt water intrusion into the sole source aquifer would compromise drinkable water for hundreds of thousands of people.
Rising Water Table
Higher groundwater levels may submerge infrastructure elements, interfering with their function and preventing access. Failed septic systems can create public health problems and harm ecosystems. Saline groundwater can corrode vulnerable infrastructure components. A higher water table also reduces the ability of the soil to absorb runoff, increasing the likelihood of flooding. [7]
The principle concerns of the DEC go beyond the issues highlighted above. Failing septic systems being submerged in a rising water table are a risk for low coastal areas, and accelerated coastal erosion due to increased wave action and more powerful and prevalent Nor’Easters and Hurricanes:
Bluffs are relict features of the shoreline, meaning they were formed by processes that no longer take place. As a result, coastal bluffs can remain stable or they can erode, moving landward as they do, but they will not increase. Bluff erosion supplies the materials that form other shoreline features: clay, fine silt, sand, gravel and boulders.
Rising sea levels combined with frequent, intense storms are likely to increase severe bluff erosion.[8]
Erosion is detrimental to the ground and surface water quality for various reasons. First, the accelerated loss of coastal land can change the balance of salt and fresh waters, as well as the wetland formation that creates natural vegetative filters that protect surface waters from storm water runoff. While wetlands can be recreated gradually as sea levels rise, developed lands in areas beyond protected wetland boundaries would constrict the creation of new wetlands.
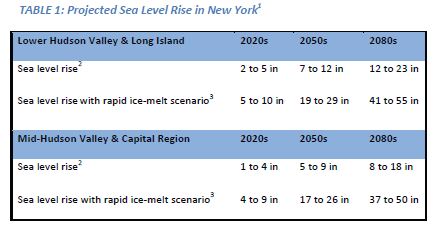
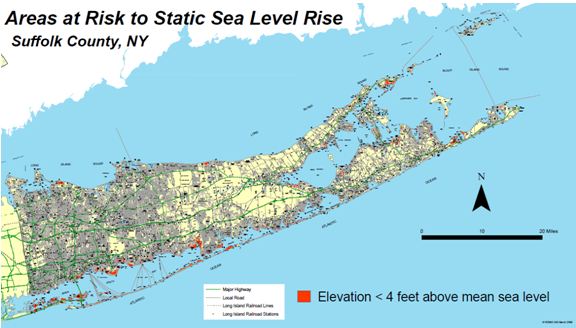
According to the DEC, the worst case scenario shows sea levels rising 41 to 55 inches (3.4 to 4.5 feet) by 2080:
Below, a GIS map of areas of Suffolk County most vulnerable if sea levels rose 4.5 feet:
The previous map highlights approximate area at risk from sea level rise of up to four feet, one-foot intervals. Take note however that this map is designed to outline areas that are potentially highly vulnerable to flooding from sea level rise. Beyond these low-lying areas, the bluffs of the north shore and barrier beaches to the south are vulnerable to accelerated erosion.
Another factor in the changing the water table’s salt to fresh water balance is land subsidence. Land subsidence is defined as follows by the US Geologic Survey (USGS):
Land subsidence occurs when large amounts of ground water have been withdrawn from certain types of rocks, such as fine-grained sediments. The rock compacts because the water is partly responsible for holding the ground up. When the water is withdrawn, the rocks falls in on itself. You may not notice land subsidence too much because it can occur over large areas rather than in a small spot, like a sinkhole. That doesn’t mean that subsidence is not a big event — states like California, Texas, and Florida have suffered damage to the tune of hundreds of millions of dollars over the years.
Compaction of soils in some aquifer systems can accompany excessive ground-water pumping and it is by far the single largest cause of subsidence. Excessive pumping of such aquifer systems has resulted in permanent subsidence and related ground failures. In some systems, when large amounts of water are pumped, the subsoil compacts, thus reducing in size and number the open pore spaces in the soil the previously held water. This can result in a permanent reduction in the total storage capacity of the aquifer system.[10]
According to Columbia University and the National Oceanic and Atmospheric Administration (NOAA), land subsidence has an impact on the levels in which the seas can rise regionally:
Over 70% of the world’s sandy beaches are retreating. In the New York metropolitan region, beaches and barrier islands are narrowing or shifting landward, in part due to ongoing sea-level rise and land subsidence. Accelerated sea-level rise may intensify the rate and extent of coastal erosion. Many beaches are artificially maintained by the U.S. Army Corps of Engineers. They have spent a cumulative total of $2.4 billion nationally and $884 million within the Tri-State region on beach nourishment projects since the 1920s.[11]
Land subsidence is not a large issue for Long Island, even with the projected population growth of Suffolk County to peak at about a
17 percent population growth between now and 2035, topping out at approximately 1.75 million people.[12] In Nassau County, the population is steady at 1.3 million people. This is due to the fact that Long Islanders do not withdraw more groundwater than what is recharged annually:
Nassau County:
Precipitation provides 660 million gallons per day (mgd) of which 315 mgd is lost to evapotranspiration and 15 mgd to direct runoff. Recharge into the groundwater system is 330 mgd. 180 mgd is pumped from the groundwater system, 40 is discharged through effluent streams, and 110 mgd is discharged underground. Consumptive use amounts to 180 mgd of which 140 mgd is lost through the sewer system, 34 mgd through sprinkling and 6 mgd through industrial-commercial use. 90% of Nassau County is served by sewers. Essentially 100% of the water in sewered areas is lost from the system. Three sewer disposal districts handle 140 mgd and this is discharged into surrounding saltwater bodies. This compares to 180 mgd of water that is pumped out of the system. Of the water pumped, 89% is from the Magothy, 5% is from the Upper Glacial and 6% is from the Lloyd aquifers. The 400 public supply wells are distributed evenly about the county.[13]
Suffolk County
The recharge in the area is 990 mgd. The total capacity of the aquifers underlying Suffolk County is about 70 trillion gallons. There are more than 600 public supply wells in Suffolk County. About 210 mgd are withdrawn by pumping with equal amounts coming from the Magothy and Upper Glacial. Most of this water is returned to the aquifer with consumptive loss estimated to be 95 mgd. The loss is through sewage systems, marine discharges and evapotranspiration associated with irrigation and lawn sprinkling.[14]
Over 138 billion gallons of water is taken each year from beneath Nassau and Suffolk Counties. In coastal areas, as water is drawn up for use, less groundwater is available to be discharged into the estuaries. The resulting loss of water and pressure allows saltwater from the ocean to flow into the aquifer, causing the ground water to become saline, resulting in a condition called “saltwater intrusion”. New water from precipitation is constantly recharging, or replenishing, the aquifers. Unfortunately, as water recharges the system, it can easily carry contaminants with it into the ground water. Since it is the shallowest and closest to most sources of contamination, the Upper Glacial aquifer is the most heavily contaminated of the three. The next most seriously contaminated aquifer is the Magothy, which is the layer below the Upper Glacial. The Magothy aquifer supplies over 90% of the water used in Nassau County and about 50% of all water used in Suffolk County.[15]
Despite the abundance of drinking water recharge and the decreased threat of land compaction when compared to other areas, if sea levels do rise the 4.5 feet that is being predicted, the water table balance and pressures will still be impacted differently. This is all thanks to elevated seas in relation to increasing groundwater withdrawal. How exactly the impacts manifest should be the subject of future geologic study.
Conclusion
In closing, the impacts of global warming will alter the sensitive hydrogeologic framework of Long Island. If the water table does rise as much as is being estimated, then most developments will be initially unaffected. The coasts of both the north and south shores, twin forks and barrier beaches will most be impacted by sea level rise, either in the form of erosion or salt water intrusion. Despite the majority of population not being directly and adversely impacted, the threat of increased erosion, intensification and prevalence of winter and Nor’ Easter storms and hurricanes will impact all Long Islanders. Of all of the issues facing ground and surface water qualities, the long term consequences and solutions of this particular problem are the most long-term and pressing.
[1] Barth and Titus 1984; Dean et al. 1987, compiled by US EPA for Greenhouse Effect, Sea Level Rise, and Land Use, http://epa.gov/climatechange/effects/coastal/SLRLandUse.html accessed on 12/15/2011
[2] Global Warming Affects Life on LI, Jennifer Smith, Newsday, August 13th 2011
[3]US EPA for Greenhouse Effect, Sea Level Rise, and Land Use, http://epa.gov/climatechange/effects/coastal/SLRLandUse.html accessed on 12/15/2011
[4] US EPA for Greenhouse Effect, Sea Level Rise, and Land Use, http://epa.gov/climatechange/effects/coastal/SLRLandUse.html accessed on 12/15/2011
[5] Future Sea Level Rise and the New Jersey Coast, Matthew JP Cooper, Michael D. Beevers, Michael Oppenhiemer, Princeton University Woodrow Wilson School of Public Affairs, November 2005
[6] Draft Shoreline Inventory and Characterization , August 2011, Island County Washington
[7] New York State Sea Level Rise Task Force: Report to the Legislature, December 31st, 2010
[8] New York State Sea Level Rise Task Force: Report to the Legislature, December 31st, 2010
[9] NYS Office of Emergency Management, April 2009, complied by the NYS DEC on December 30th, 2010
[10] USGS Water Science for Schools, Land Subsidence http://ga.water.usgs.gov/edu/earthgwlandsubside.html accessed on 12.21.2011
[11] Climate Change Informational Resources, New York Metropolitan Region, Columbia University Board of Trustees, NOAA, 2004-2006 http://www.ciesin.columbia.edu/
[12] Levy Releases 2035 Plan Supplement, John Callegari, Long Island Business News 12/20/2011
[13] Hydrogeologic Framework of Long Island, handout for SUNY Stony Brook, containing research from Buxton, H.T., and E. Modica, Patterns and rates of groundwater flow on Long Island, New York, Ground Water, 30, 857-866, 1992.
Franke, O.L., and N.E. McClymonds, Summary of the hydrologic situation on Long Island, as a guide to water-management alternatives, U. S. Geological Survey Professional Paper, 627, F1-F59, 1972.
Proceeding of Conference on Water Quality on Long Island, sponsored by The Center for Regional Policy Studies and the Long Island Regional Planning Board, held at SUNY Stony Brook, January 26, 1993.
[14] Hydrogeologic Framework of Long Island, handout for SUNY Stony Brook,
[15] “Geothermal Heat Pump Manual”, prepared for the City of New York Department of Design and Construction, 2002


Thank you Richard.
Extremely important info well presented.